
yeznable
[ 맛보기 ] Windows + WSL2 + Docker + Prometheus + Grafana 본문
필요할 때 Prometheus와 Grafana를 활용할 수 있게 간단하게나마 테스트 구현해본 경험을 남겨둔다.
Windows 환경에서 Docker Desktop은 요즘 회사에서 쓰기엔 유료로 정책이 바뀌었고 너무 손쉬운 버튼 클릭에 문제가 생겼던 적이 있어서 WSL2와 Docker CLI를 활용했다.
WSL2 확인
전에 도커 데스크탑을 사용했던적이 있어서 확인해보면 남아있다.
이번에는 사용하지 않고 Docker CLI를 쓸거기 때문에 Stopped 상태여도 상관 없다.
# wsl 확인
wsl --list --verbose

# 출력 결과
#   NAME                   STATE           VERSION
# * Ubuntu-20.04           Running         2
#   docker-desktop         Stopped         2
#   docker-desktop-data    Stopped         2
WSL2에 도커 설치
도커를 WSL2에 설치한다.
# WSL2 접속
wsl -d Ubuntu-20.04

# apt 업데이트
sudo apt update && sudo apt upgrade -y

# 도커 설치 스크립트 다운로드
curl -fsSL https://get.docker.com -o get-docker.sh

# 도커 설치 스크립트 실행
sh get-docker.sh
나는 이때 이런 메시지를 만났는데 WSL Ubuntu 내부가 아니라 Windows 측 Docker CLI가 PATH에 잡혀 있어서 나타나는 메시지라고 한다.
무시하고 기다려주면 설치가 잘 완료된다.
# 불안하게 하는 메시지
Warning: the "docker" command appears to already exist on this system.

If you already have Docker installed, this script can cause trouble, which is
why we're displaying this warning and provide the opportunity to cancel the
installation.

If you installed the current Docker package using this script and are using it
again to update Docker, you can ignore this message, but be aware that the
script resets any custom changes in the deb and rpm repo configuration
files to match the parameters passed to the script.

You may press Ctrl+C now to abort this script.
+ sleep 20
systemd 기반 자동 실행 설정
# 설정 파일 확인
sudo nano /etc/wsl.conf

# 나는 이미 해당 내용이 적힌 파일이 존재했음
# 없으면 새로 만들어야 함
# [boot]
# systemd=true

# WSL 종료 후 다시 시작
wsl --shutdown
wsl -d Ubuntu-20.04

# systemd가 실제로 동작 중인지 확인
ps -p 1 -o comm=
# 출력 결과
# systemd

# 도커 서비스 상태 확인
systemctl status docker
Windows exporter 설치 및 실행
내가 테스트 해보고 있는 환경이 Windows이기 때문에 Node exporter가 아닌 Windows exporter를 써줘야 한다.
Windows exporter는 아쉽게도 공식 다운로드 링크에는 없다.
다음의 링크에서 "windows_exporter-0.30.6-amd64.exe" 파일을 다운로드 받았다.
Releases · prometheus-community/windows_exporter
Prometheus exporter for Windows machines. Contribute to prometheus-community/windows_exporter development by creating an account on GitHub.
github.com
다음과 같이 설치되었다.

windows_exporter는 그냥 더블클릭하면 실행 창이 뜨면서 실행된다.
나중에는 백그라운드 실행되도록 해야겠다.
[ 윈도우 서버 ] CMD 뜨지 않게 백그라운드 실행
윈도우 서버를 운영하다보면 간절해지는 것중 하나가 nohup 기능이다.리눅스 서버에서는 간단하게 nohup을 쓰면 백그라운드 실행이 가능한데 윈도우에서는 다양한 방법이 있다고는 하지만 nohup같
yeznable-blog.tistory.com
오늘은 그냥 테스트니까 창을 띄워놓고 진행한다.
http://localhost:9182/metrics 주소에 접속해보면 exporter가 정보를 잘 내보내고 있다는 것을 확인할 수 있다.
MySQL exporter 설치 및 실행
MySQL exporter를 다음 공식 다운로드 링크에서 설치한다.
Download | Prometheus
An open-source monitoring system with a dimensional data model, flexible query language, efficient time series database and modern alerting approach.
prometheus.io
MySQL에 다음과 같이 유저를 추가한다.
# exporter_password는 원하는 비밀번호로 수정
CREATE USER 'exporter'@'localhost' IDENTIFIED BY 'exporter_password';
GRANT PROCESS, REPLICATION CLIENT, SELECT ON *.* TO 'exporter'@'localhost';
mysqld_exporter.exe 실행 파일이 있는 동일한 경로에 .my.cnf 파일을 생성해서 다음과 같이 입력한다.
[client]
user=exporter
password=exporter_password
mysqld_exporter.exe 실행 파일을 더블클릭하면 windows_exporter와 같이 창이 열리면서 실행된다.
http://localhost:9104/metrics 주소에 접속해보면 exporter가 정보를 잘 내보내고 있다는 것을 확인할 수 있다.
Prometheus 실행
WSL에 접속해 다음과 같이 준비하고 실행한다.
# wsl 접속
wsl -d Ubuntu-20.04

# 디렉토리 생성
mkdir ~/prometheus

# WSL이 바라보는 Windows의 IP 확인
cat /etc/resolv.conf | grep nameserver
# 실행 결과 예시
# nameserver 172.x.x.x

# 파일 생성
nano ~/prometheus.yml
# 아래 내용 입력 및 저장
# global:
#   scrape_interval: 15s
#
# scrape_configs:
#   - job_name: "windows_local"
#     static_configs:
#       - targets: ["<위에서 찾은 IP>:9182"]
#   - job_name: 'mysql'
#     static_configs:
#       - targets: ['<위에서 찾은 IP>:9104']

# Prometheus 실행
docker run -d --name prometheus \
  -p 9090:9090 \
  -v ~/prometheus/prometheus.yml:/etc/prometheus/prometheus.yml \
  prom/prometheus
이제 http://localhost:9090 주소로 접속하면 다음과 같은 화면이 뜬다.

Exporter들이 잘 연결되어있는지는 Status > Target health 로 들어가보면 다음과 같이 State 아래에 UP 상태로 확인할 수 있다.

Grafana 실행 및 데이터 소스 설정
이제 WSL에서 다음 명령어로 Grafana를 띄운다.
# Grafana 실행 명령어
docker run -d --name=grafana \
  -p 3000:3000 \
  grafana/grafana
Prometheus 때와 같이 http://localhost:3000으로 Grafana에 접속할 수 있다.
admin / admin으로 로그인하고 비밀번호를 변경하면 다음과 같은 화면이 나타날 것이다.

좌측에 Connections > Data sources에 들어가서 "+ Add new data source" 버튼을 클릭한다.
나는 이미 실습하면서 추가해둔 Prometheus가 떠있다.

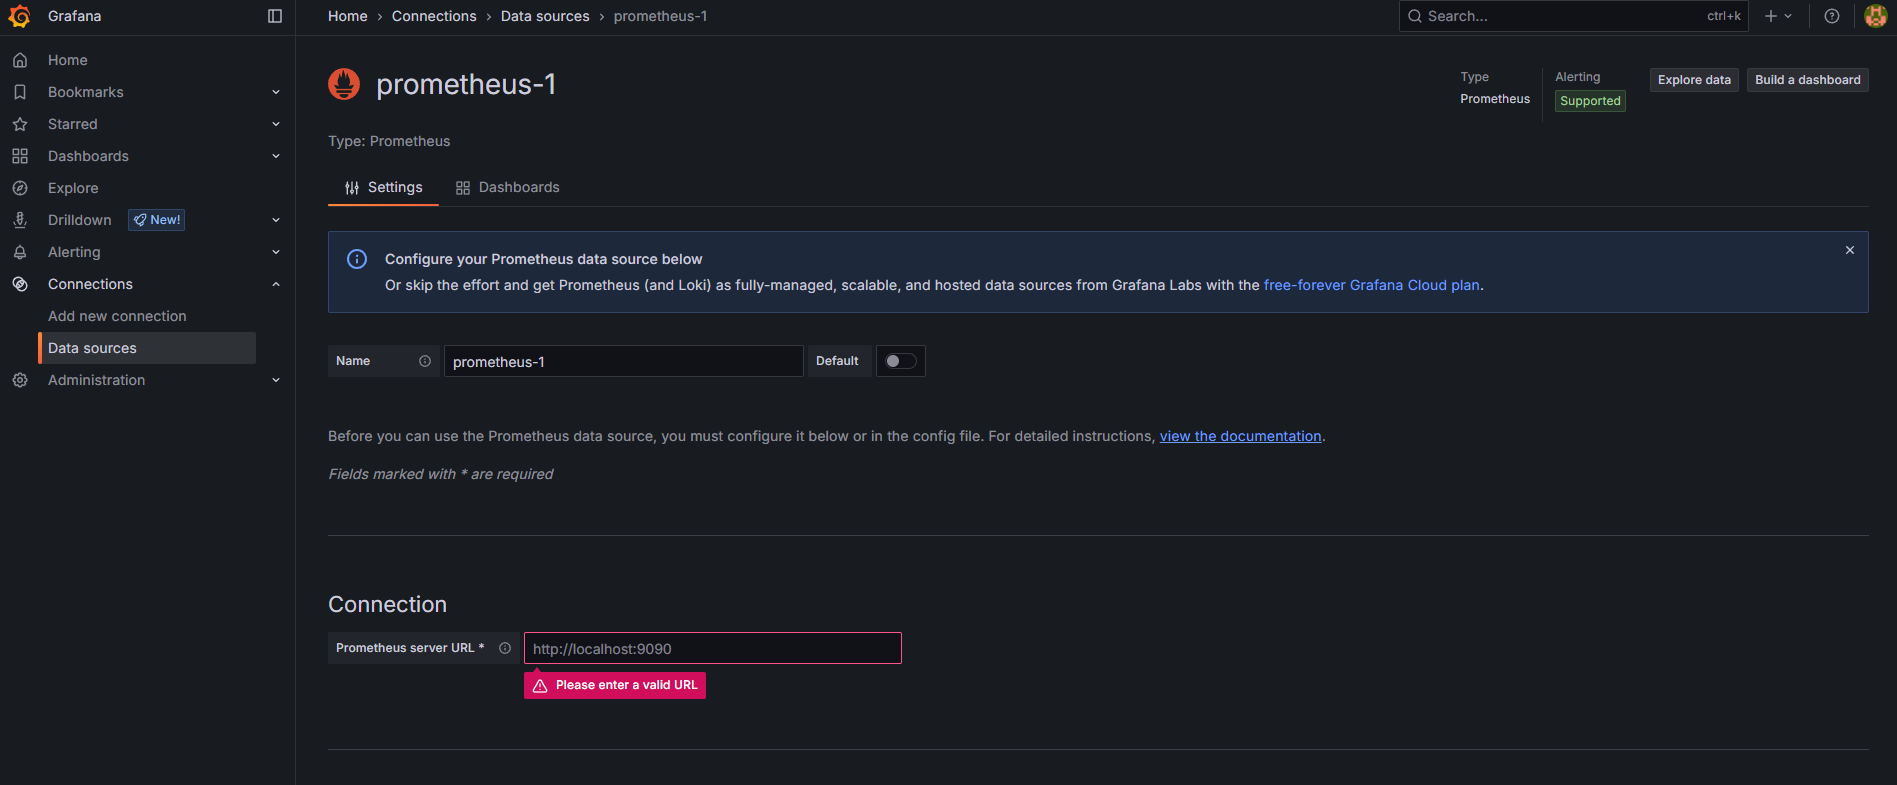
"+ Add new data source" 버튼을 클릭해서 나온 데이터 소스 유형 중에 Prometheus를 선택하고 Connection에 주소를 작성한다.
http://localhost:9090로 하면 된다고 하는데 나는 에러가 나서 다음과 같이 찾아서 설정했다.
# WSL에 접속된 상태로 명령어 실행
ip addr | grep inet
# 실행 결과 중에 아래와 같은 형식의 결과 앞에 나온 IP 활용
# inet 172.x.x.x/x brd 172.x.x.x scope global eth0
결국 http://<위에서 찾은 IP>:9090로 입력하니 오류가 없었다.
그러고 아래쪽으로 쭉 내려서 "Save & test" 버튼을 누른다.

Grafana 대시보드 설정
필요에 따라 대시보드를 만들수도 있겠지만 만들어진 좋은 대시보드들을 가져다가 사용할 수도 있다.
다음 링크에 들어가서 내가 필요한 Windows, MySQL이라고 검색했다.
Grafana dashboards | Grafana Labs
No results found. Please clear one or more filters.
grafana.com

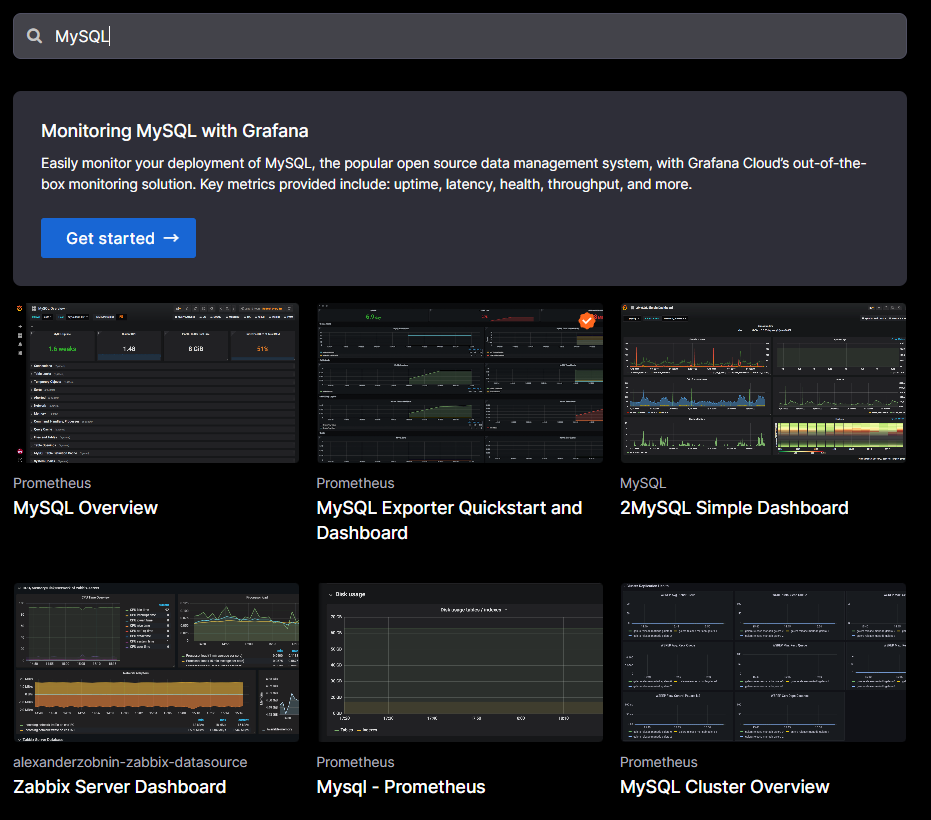
상단에 있는게 좋은거 아닐까 싶어서 Windows Exporter Dashboard 2024와 MySQL Overview를 선택해 들어갔다.
들어가면 오른쪽 하단에 "copy ID to clipboard" 버튼을 누른다.

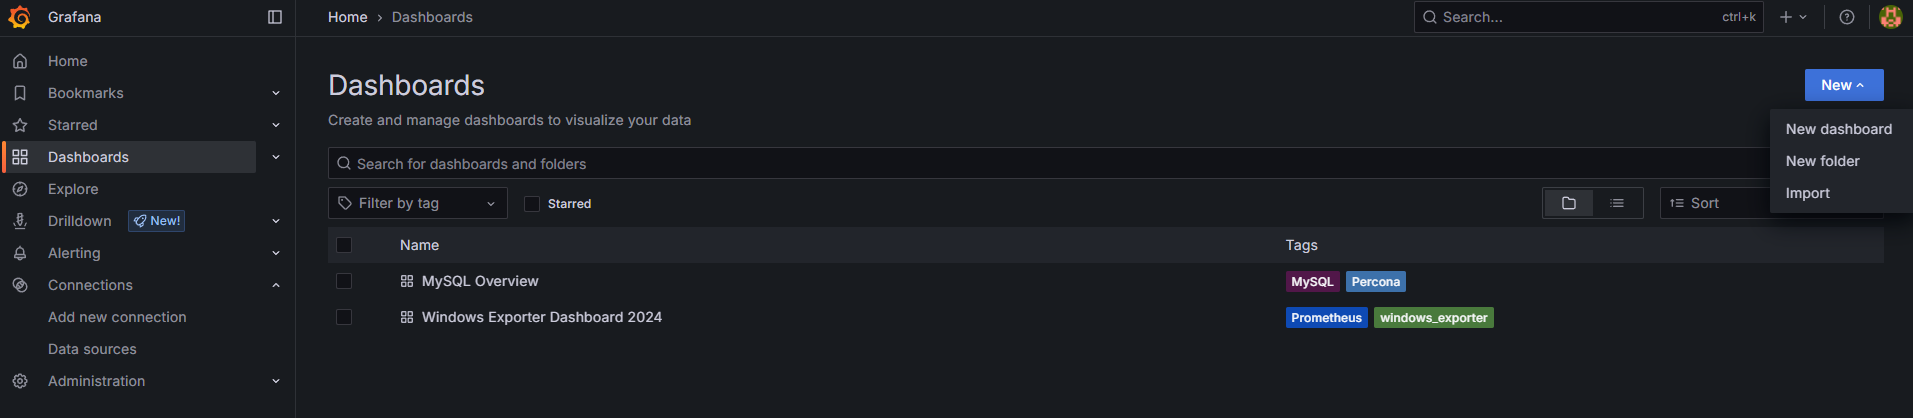
그라파나에서 Dashboards 메뉴로 들어가 오른쪽에 파란 New 버튼 > Import 를 누른다.
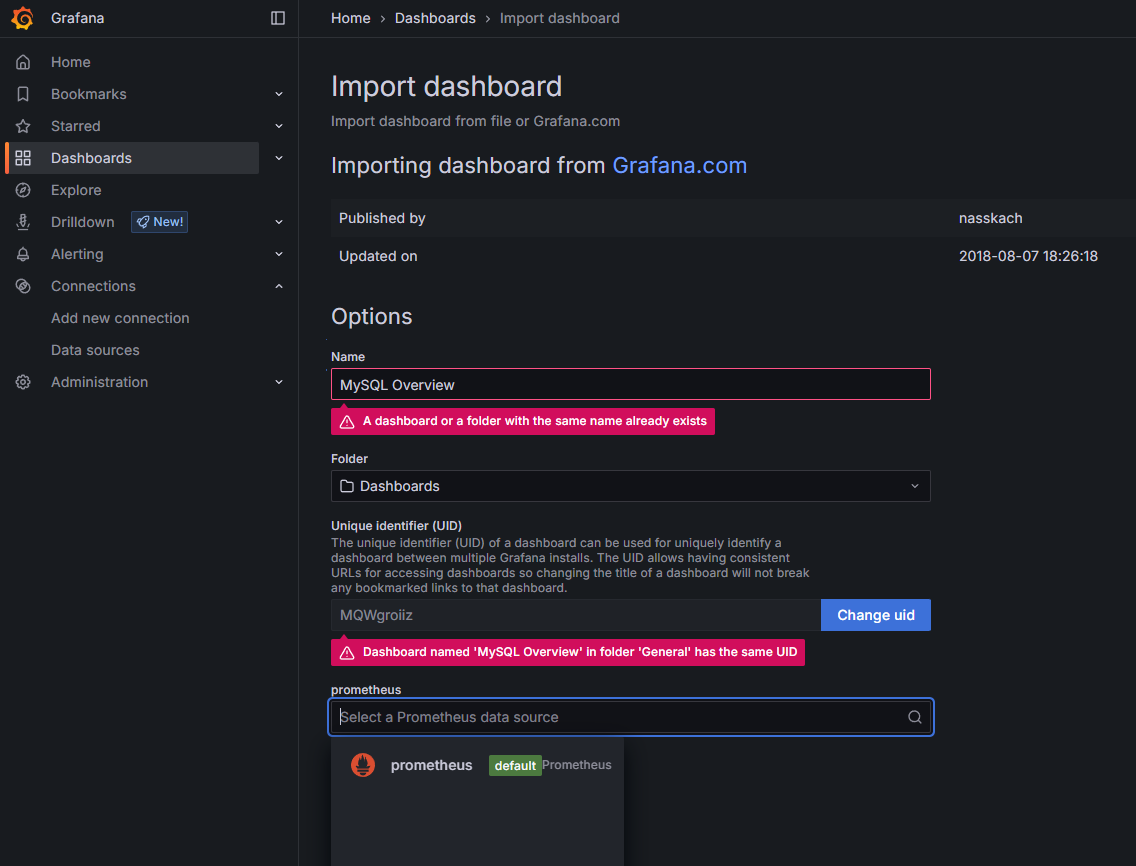
나타난 Import dashboard 화면 중간의 "Grafana.com dashboard URL or ID" 창에 복사해둔 ID를 입력하고 "Load" 버튼을 누른다.
원하는 대시보드가 맞는지 이름을 확인하고 아래쪽에서 데이터 소스로 추가해둔 Prometheus를 설정한 뒤 Import 버튼을 누른다.
나는 이미 만들었던 대시보드라서 이름이 동일하다는 경고가 나온다.
Dashboards 메뉴에 들어가면 새로운 대시보드 항목이 추가되어있고 클릭하면 대시보드를 확인할 수 있다.

'하는 일 > 데이터엔지니어링' 카테고리의 다른 글
| [ 맛보기 ] ClickHouse - OLAP 특화 데이터베이스 (0) | 2025.05.27 |
|---|---|
| [ 맛보기 ] 현대적인 워크플로우 오케스트레이션 Kestra (0) | 2025.05.21 |
| [ Airflow ] Linux + Airflow 로그 삭제 (0) | 2025.05.13 |
| [ 따라잡기 ] Modern Data Stack 상위 랭킹 정리 (0) | 2025.05.13 |
| [ 트러블슈팅 ] Windows + uv + PyGWalker + Streamlit (0) | 2025.05.08 |


